What are the Fibonacci Retracements and Projections?
R. N. Elliott revised his well known theory of market wave movement in the 1940’s to take into account his new and important observations that markets tended to retrace preceding impulses by Fibonacci ratios computed from the length of that impulse.
In addition, Elliott noted that subsequent impulses tend to extend to Fibonacci ratios or Projections of the lengths of the preceding observed impulses.
Computing Fibonacci Ratios and Projections
Entries in the classic Fibonacci sequence are computed by adding the previous two numbers together. This results in a numerical sequence as follows:
1, 1, 2, 3, 5, 8, 13, 21, 34, 55, 89, 144…
An especially interesting characteristic of this naturally generated number sequence is that the ratio of adjacent numbers approaches the Golden Mean of 0.618, while the ratio of numbers two places apart approaches 0.382, and the ratio of numbers three places apart approaches 0.236.
Along with 1.0 and 0.5 that occur respectively as the first and second ratios in the Fibonacci sequence, these ratios make up the classic set of Fibonacci Ratios that so intrigued R.N. Elliott that he put them firmly into his Elliott Wave Theory as a very significant revision.
Accordingly, the percentages of the original impulse length typically used by Elliott Wave theorists to compute the so-called Fibonacci Retracement levels are 23.6%, 38.2%, 50%, 61.8% and 100%.
This means that if an upward impulsive move from 1.2500 to 1.5000 is observed in EURUSD, then the resulting theoretical Fibonacci Retracement levels that may occur during the retracement of that impulse would be computed as follows:
- 1.5000 – 1.2500 = 0.2500
- 0.2500*23.6% = 0.0590 subtracted from 1.5000 = 1.4410
0.2500*38.2% = 0.0955 subtracted from 1.5000 = 1.4045
0.2500*50.0% = 0.1250 subtracted from 1.5000 = 1.3750
0.2500*61.8% = 0.1545 subtracted from 1.5000 = 1.3455
0.2500*100.0% = 0.2500 subtracted from 1.5000 = 1.2500
The ratios typically used by traders to compute Fibonacci Projection levels of an impulsive or corrective wave are 1:0.618, 1:1, 1:1.236, 1:382, 1:1.500 and 1:1.618. These projection ratios are first multiplied by the length of the existing wave and then projected off the start of the wave just starting to form.
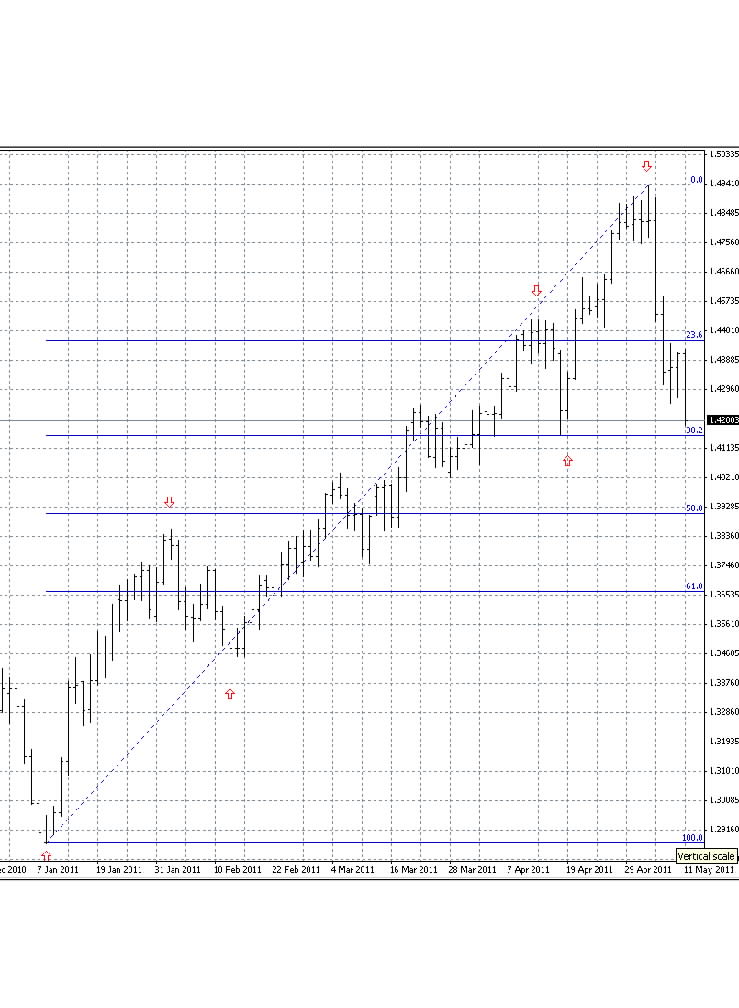
An Elliott Wave Impulse Overlaid With Fibonacci Retracement Levels

The graph shown above is an actual daily bar chart for the EURUSD currency pair that can be obtained from currency brokers. The above chart was produced using a demo online trading account by the popular and relatively sophisticated MetaTrader4 forex trading platform supported by many online forex brokers.
The red arrows on the chart show the ends of each wave of a classic Elliott five wave upward impulse that has recently completed and is now starting to correct downward into the range of the fourth wave of one lesser degree delimited by the top of wave III and the bottom of wave IV. The set of horizontal lines appearing in royal blue are drawn at each of the classic Fibonacci Retracement levels.
Note how the market in EURUSD has already retraced past the 23.6% Fibonacci Retracement level of the preceding impulse and then proceeded downwards to almost touch the 38.2% level. Theoretically, if the market then sustains a break below the 38.2% level, it will then move lower to touch the 50% Fibonacci Retracement level which would therefore become a trading target that a trader can include in their forex review for EURUSD.
This illustrates the typical sort of market price behavior that prompted Elliott to include Fibonacci ratios in his considerably more comprehensive Elliott Wave Theory.
For more exclusive content, follow us on Twitter or join us on Facebook.


Comments (0 comment(s))