AUDCHF Analysis – Broken resistance tested as a support

The last piece will be about the AUDCHF, which we previously mentioned at the beginning of the last week. Back in that day, the situation was very promising for the sellers as we were in a deep downtrend, bouncing from the strong horizontal resistance. This is what we wrote back then:
“The legitimate signal to go short, will be triggered, when the price will break the black horizontal line. The target for that drop are the lows from September. „
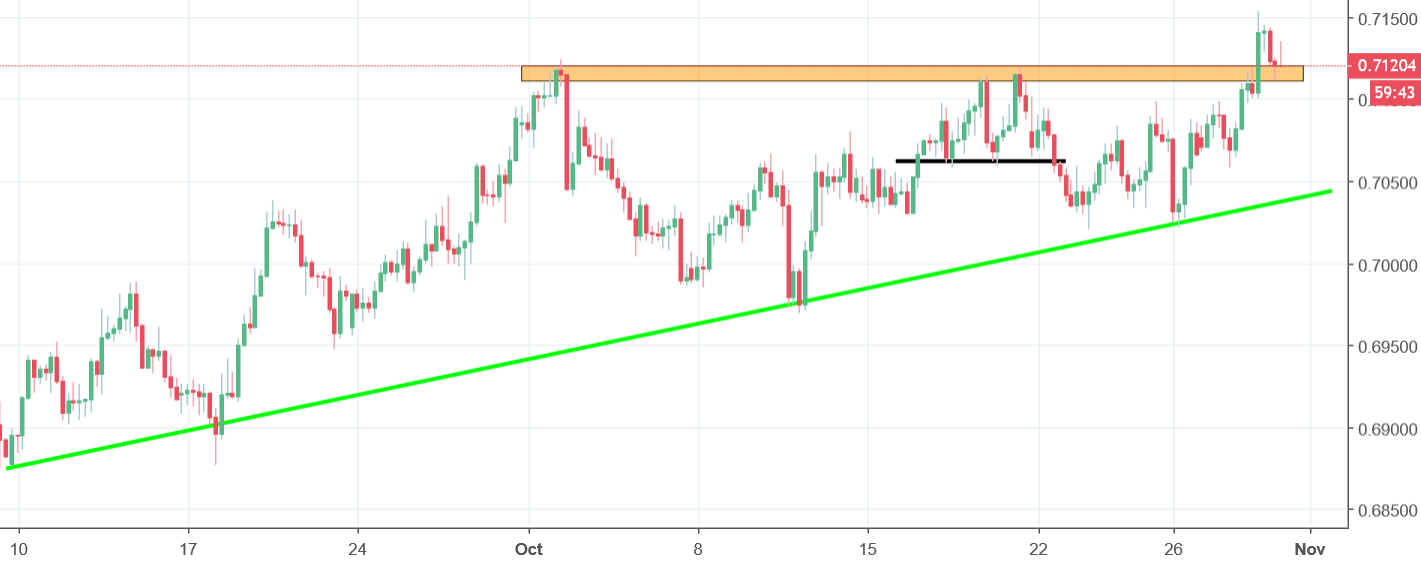
So what happened? The black line was broken – as expected. The price went lower – as expected. The thing is that the drop lasted only few days. AUDCHF did not manage to break the green up trendline and went higher. The formation that eventually emerged on the chart was the ascending triangle pattern (orange resistance, green dynamic support). Formation resulted with the breakout of the horizontal resistance and a buy signal. Today, we are testing this line as a closest support and price being above that area is still a positive sign. The come back below the orange area can bring us a false breakout pattern and a major reversal but for now, sellers should not get too excited.


Comments (0 comment(s))