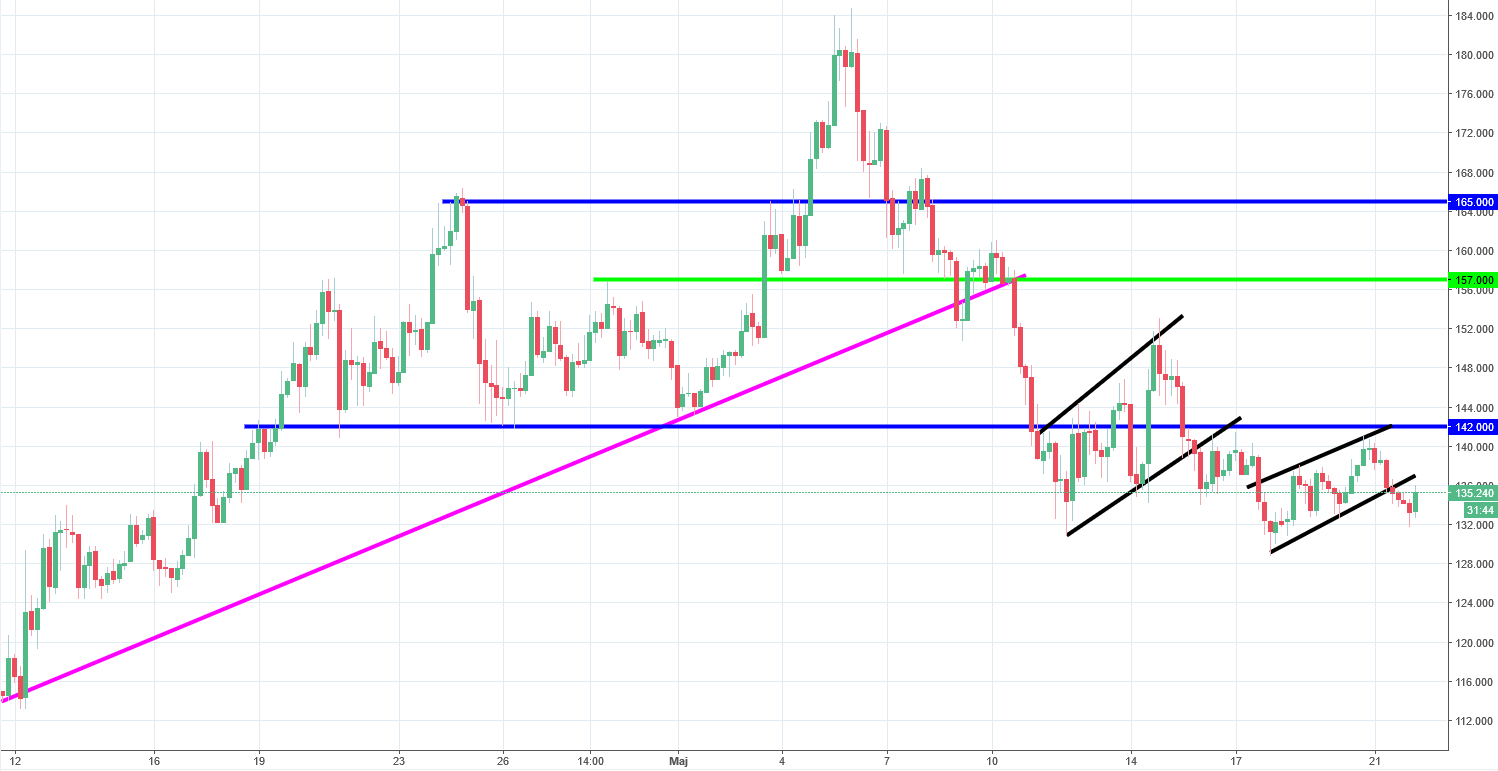
Litecoin Analysis – Bearish flag leads to the sel signal

Today, we start with the Litecoin. The last time we analysed this crypto on the 14th of May and we were bullish. The price was on the 150 USD and the positive sentiment was set by the false breakout pattern – usually a very strong indicator of a reversal. In our previous analysis we said:
„The comeback above the 142 and a breakout of the mid-term down trendline (black) look extremely positive. As for now, the buy signal is on with the potential target on the 157USD (green). That is just the first one, in my opinion, the price should go even higher and eventually reach the second one, on the 165 USD (upper blue). „

Those levels were not reached and shortly after those words were published, the whole crypto market turned and went lower. The price came back below the 142 USD (lower blue) and created a bearish flag (black lines). After that, 142 USD was tested as a resistance and helped the price to set new mid-term lows. In the last few days, Litecoin created another flag, which also resulted with a bearish breakout. From the technical point of view, that sets a sell signal and opens us a way towards the lows from the April. As long, as we stay below the 142 USD, the sentiment is negative.


Comments (0 comment(s))