NZDUSD Analysis – Broken resistance

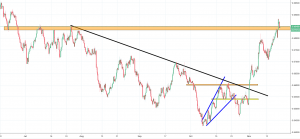
We owe you an update about the NZDUSD. For the last time, we analysed this instrument on the 2nd of November, when the price was having a fresh buy signal. Back in that day, we were expecting a small bearish correction first and then, a proper rise. Take a look yourself:
“That upswing allowed to break the black resistance, which was a long-term down trendline. That actually gives us a buy signal. Currently, we can expect a typical pull-back but most probably, it will only be a correction and the positive sentiment should remain intact. „

This is precisely what happened. The price made a small correction and then went higher. Few days later we had another one and this one also ended with the NZDUSD making higher highs. The last week ended with the kiwi breaking the major horizontal resistance on the 0.685 (orange) and the new week starts with a test of that level as a closest support. Situation here is similar to this one on the AUDUSD – it is a typical price action movement and the bullish sentiment here is still dominant. Our outlook for the future remains positive.


Comments (0 comment(s))