What are the Bollinger Bands?
The Bollinger Bands indicator is a combination of two lines placed at an equal volatility dependent distance above and below a central moving average line. The Bollinger Bands were originally invented by John Bollinger who introduced this popular technical indicator to the financial markets in the 1980’s. Since that time, the Bollinger Bands have taken their well deserved place among the most popular technical indicators used by forex traders.
Due to their considerable popularity among technical traders, Bollinger Bands are often incorporated into trade plans and are sometimes mentioned in forex technical analysis commentaries. Furthermore, most of the top forex brokers offer forex trading platforms and technical analysis software that will display the Bollinger Bands indicator for any chosen major currency pair.
The Bollinger Bands are usually depicted visually by plotting them over the price action on an exchange rate chart for a particular currency pair. As a result, the Bollinger Bands are generally shown on the same time scale and periodicity as the line, bar or candlestick chart to which the indicator corresponds and is superimposed upon.
Computing Bollinger Bands
The Bollinger Bands are calculated in a standardized way by the technical analysis systems provided by forex trading brokers. The central line is usually computed as a simple moving average of the price action taken over a selected number of periods.
The two lines plotted around the central moving average line are determined by adding a certain number of standard deviations of recent price movement to the indicator’s central line to create the Upper Bollinger Band. Similarly, the same number of standard deviations is subtracted from the central moving average line to generate the Lower Bollinger Band.
This computation method makes the Bollinger Bands’ values dependent on recently observed forex market price volatility. As a result, the bands tend to narrow when volatility has been low, while they usually widen when volatility has been high.
Most traders engaged in forex trading online using Bollinger Bands will use a central line parameter of 20 periods to compute the simple moving average, although other forms of moving average can also be used. Such traders will also typically use a band width of two standard deviations of the price movement observed over that same 20 day period to generate the Upper and Lower Bollinger Bands.
Sample Chart of Bollinger Bands
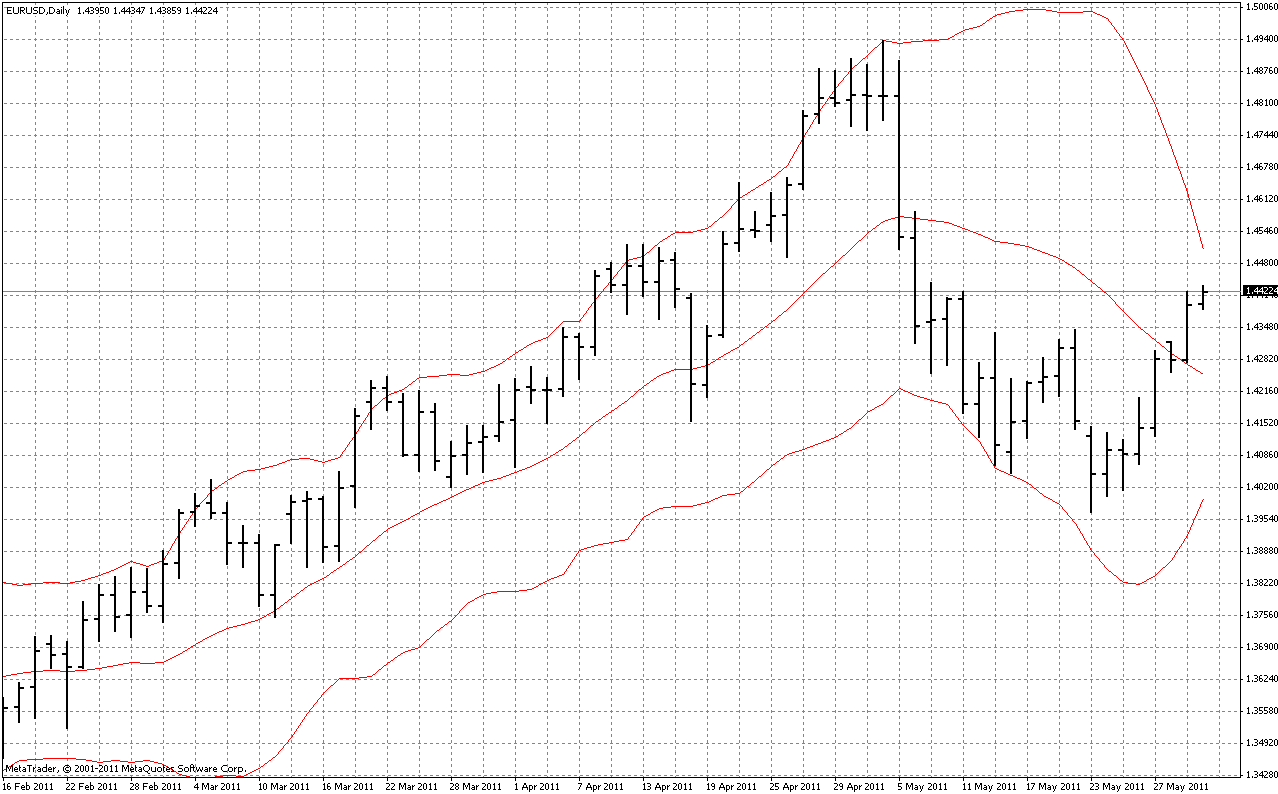
Diagram #1 above shows a daily price chart of EURUSD with a typical set of three (2,20) Bollinger Bands superimposed over the price action.
The Bollinger Bands are plotted as red lines placed two standard deviations above and below the central line that is computed as a simple, 20 period moving average.
Note from the chart how the Upper and Lower Bollinger Bands tend to contain the price action for EURUSD, with the central line providing support in an upwards trend and resistance in a down trend.
Applications of Bollinger Bands
The Bollinger Bands are one of the most helpful indicators used when forex trading online to help traders assess the risk involved in trading the market as determined by its recent price action. For example, riskier markets tend to have wider Bollinger Bands, while safer markets to trade tend to have narrower Bollinger Bands.
When Bollinger Bands are used as a forex trading signal generator, traders might watch for the market to cross over the central moving average line. Such a situation is known as a crossover and helps the technical analyst generate useful trading signals from Bollinger Bands.
Such traders might think that the Bollinger Bands generate buy signals when the market crosses above its central line. They could then place their take profit order in the region of the Upper Bollinger Band that might be considered an overbought region. Similarly, sell signals could be generated when the market crosses below the central line and take profit orders on stops could be located near the Lower Bollinger Band that can reflect oversold market conditions.
Nevertheless, others using swing trading strategies might use the market trading above the Upper Band as a signal to sell with a take profit at the indicator’s central line. They would also tend to buy when the market trades below the Lower Bollinger Band, again with a take profit placed at the center line.
For more exclusive content, follow us on Twitter or join us on Facebook.


Comments (0 comment(s))