IOTA Analysis – Strong resistances ahead!

Thursday for us starts with IOTA, which was previously analysed on the 24th of May. Back then, the price was around 1.47 USD and was giving us a strong sell signal. That is what we wrote in our previous piece:
“Target for this downswing is on the 0.95, which was an important support in April. Chances that we will get there are high and this selling occasion looks sweet. „

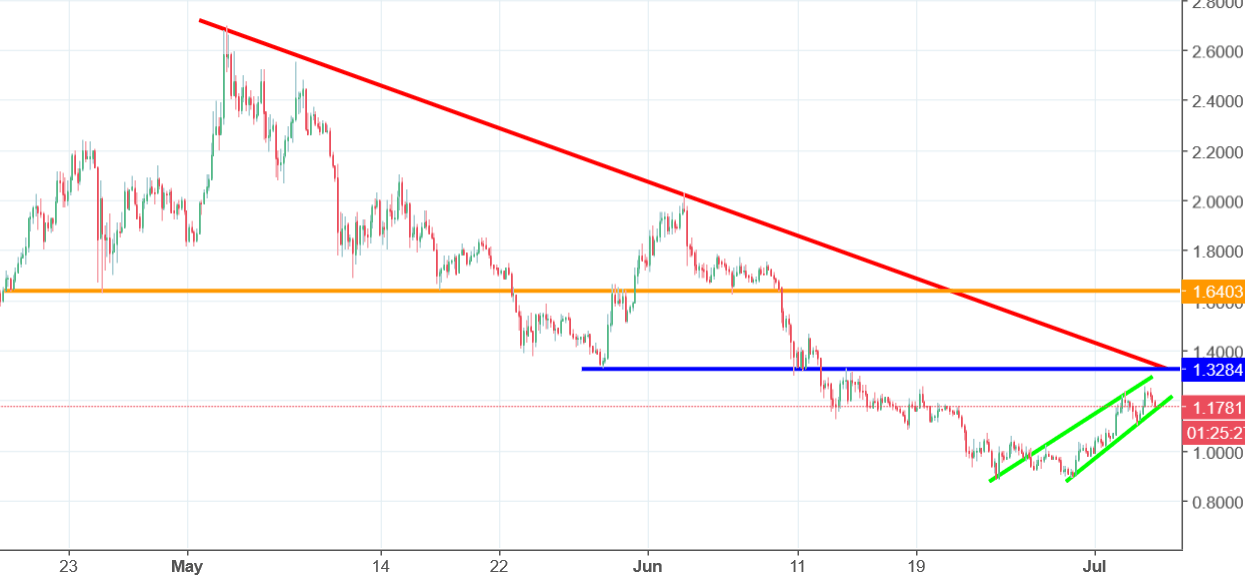
As you can see, we were expecting almost 30% drop in value. That is precisely what happened. In the end of June, IOTA reached lows on the 0.9 USD and bounced. Even our target was respected! (0.05 USD difference is obviously acceptable, this is not a pharmacy). After reaching new lows, the price created a flag formation (green lines) and that is where we are now.
What will happen now?
Flag is a trend continuation pattern so we should continue to go down. What is more, we are ahead of strong resistances. First one is the mid-term down trendline (red) and the second one is the horizontal one around the 1.32 USD (blue). Price getting there can be a great selling opportunity, our view on this is pessimistic.


Comments (0 comment(s))