CADCHF Analysis – Very handsome drop

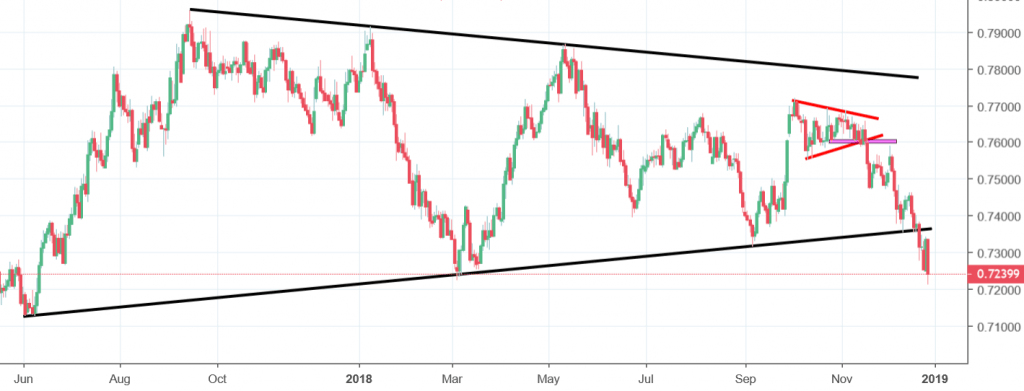
Technical part of today’s run finishes with the analysis of the CADCHF. Previously this pair was analyzed here on the 20th of November, when the price broke from a smaller triangle and aimed the lower line of the bigger one. We were bearish, check it out, yourself!:
“The lower black line is the aim, which still makes it a good trading opportunity. Unfortunately the risk to reward ratio is a bit worse than initially and the risk of the bullish correction is much higher now. Going short now is maybe no the best idea on the record but after a small bullish correction, why not? „

You are definitely not surprised that we were right as that just happens here. It is a kind of our thing, tradition, if You will. The price indeed tested our target. Respected that line as a support for few days (!!!) and then, eventually broke it. That was pretty nice but the breakout of he lower black line itself is even better. It is better because it gives us a long-term sell signal, which is valid especially on the weekly chart. Sell signal is ON, as long as the price stays below the lower line of the giant symmetric triangle pattern.


Comments (0 comment(s))