USDJPY Technical Outlook

The Intraday sentiment for the USD/JPY pair is still overall neutral and this raises the chances for more sideway consolidations. With 102.80 still relevant as a minor support level, but the market still slightly favours more growth for the pair. Price actions from 98.97 are probably developing into a medium-term consolidation. Above 104.62 temporary top will target 107.48 resistance. But we’d expect strong resistance from 38.2% retracement of 123.74 to 98.97 at 108.42 to limit upside. Meanwhile, break of 102.80 minor support will turn bias back to the downside for 100.07 support.
Looking at the bigger picture, the current market condition indicates that a medium-term support is in place at 98.97. Price action around that region is settling into a consolidation pattern. But at this point, we’re expecting at least another dip to 61.8% retracement of 75.56 (2011 low) to 125.85 at 94.77 before the trend reverses. However, sustained break of 55 weeks EMA (now at 109.25) will argue that the trend has reversed earlier than we thought and will turn outlook bullish.
USDJPY D1 Chart

On the daily chart, the pair is trading in the upper Bollinger band. The price remains above the EMA65 but below the EMA130 and SMA200 that start turning horizontally. The RSI is clearly on a bullish path as it draws closer to the overbought zone at the 70 mark. The CCI is already up as well showing signs of a slowing.
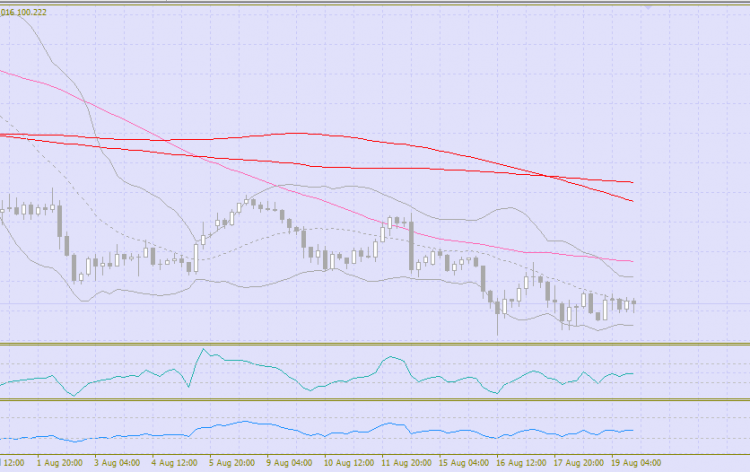
USD/JPY, H4
On the 4-hour chart, the pair is trading just around the middle MA of Bollinger Bands. The price remains below its moving averages that recently switched to a downtrend which is most likely short term. The RSI is just around its mid-point. The CCI is mostly in line with the RSI as it hovers in the middle and strongly suggests the continuation of an uptrend.
Support/Resistance Levels
Support levels: 102.85 (local lows), 102.30 (active trade), 101.74 (October lows).
Resistance levels: 104.55 (local highs), 105.30 (61.8% Fibonacci retracement), 106.11 (May lows).
Trading Hints
Since the pair has staged a breakout from its long-term descending trendline. The rise is likely to continue so no room for SELL positions in the near term.
A BUY positions can be placed from the level of 104.65 with targets at 105.30, 106.01 and stop-loss at 104.33. Validity – 3-4 days.
Short positions can be opened from the level of 102.85 with targets at 102.30, 101.74 and stop-loss at 103.16. Validity – 3-4 days.


Comments (0 comment(s))